Your Business Is Generating Intelligence Every Day. We Make Sure You Can See It, Understand It, and Act On It.
The Data Problem Most Indian Businesses Have But Rarely Name
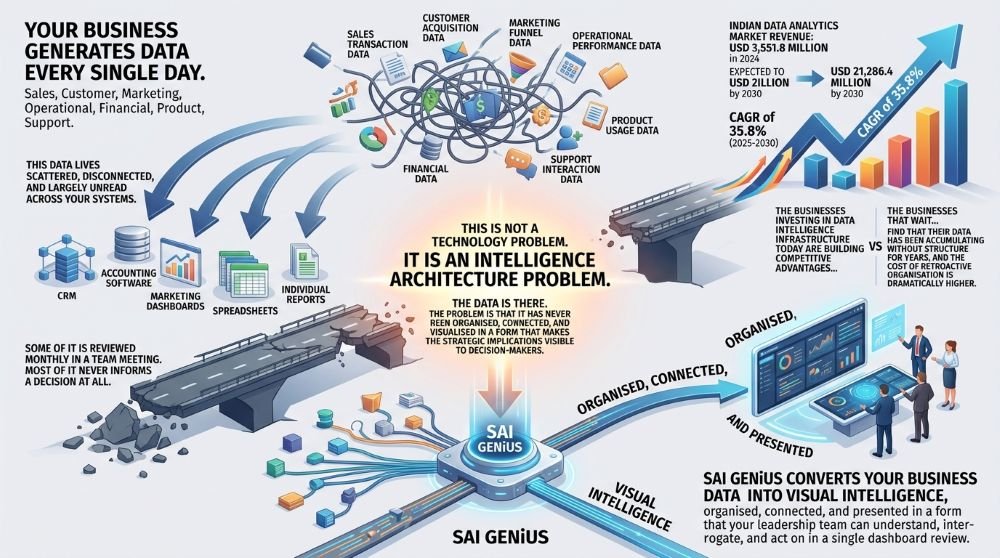
Your business generates data every single day. Sales transaction data. Customer acquisition data. Marketing funnel data. Operational performance data. Financial data. Product usage data. Support interaction data.
This data lives scattered, disconnected, and largely unread across your CRM, your accounting software, your marketing dashboards, your spreadsheets, and your team’s individual reports. Some of it is reviewed monthly in a team meeting. Most of it never informs a decision at all.
This is not a technology problem. It is an intelligence architecture problem. The data is there. The problem is that it has never been organised, connected, and visualised in a form that makes the strategic implications visible to decision-makers.
The Indian data analytics market generated a revenue of USD 3,551.8 million in 2024 and is expected to reach USD 21,286.4 million by 2030, growing at a CAGR of 35.8% from 2025 to 2030.4 The businesses investing in data intelligence infrastructure today are building competitive advantages that will compound significantly as their data assets grow. The businesses that wait until they are “bigger” to invest in data intelligence will find, when they are bigger, that their data has been accumulating without structure for years, and the cost of retroactive organisation is dramatically higher than the cost of building it correctly from the beginning.
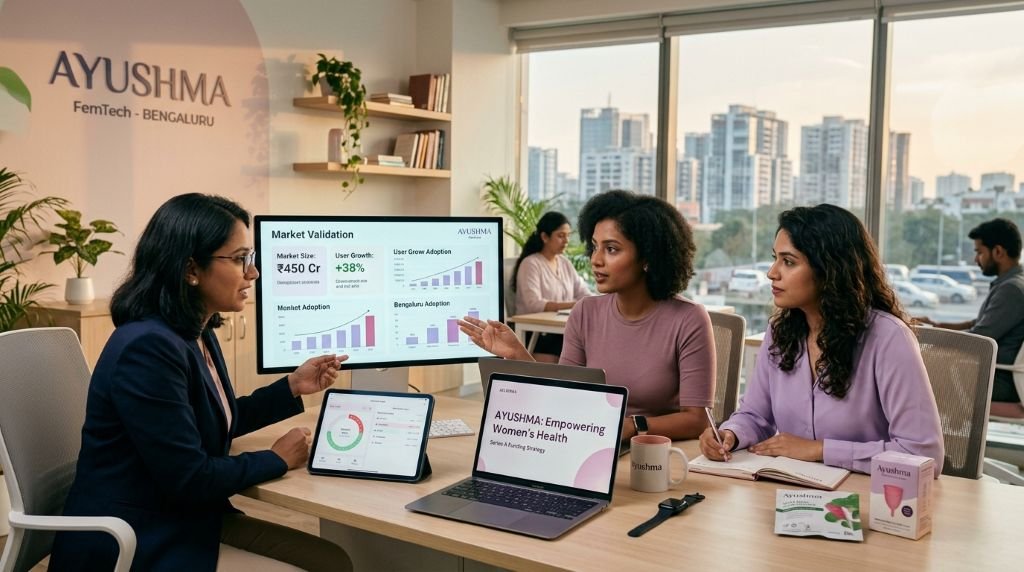
SAI GENiUS converts your business data into visual intelligence, organised, connected, and presented in a form that your leadership team can understand, interrogate, and act on in a single dashboard review.
Sub-Service Types Within Data Analytics & Visualization
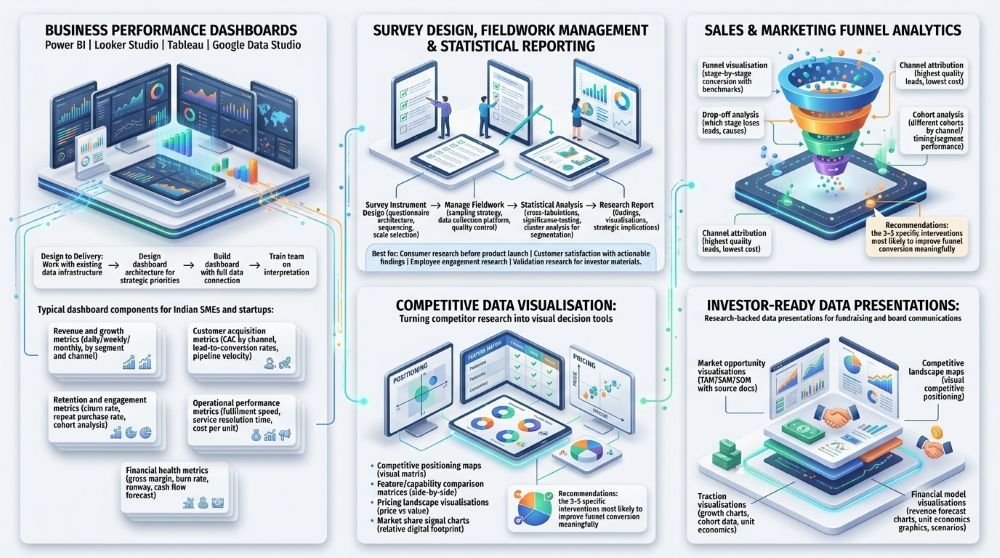
Business Performance Dashboards Power BI | Looker Studio | Tableau | Google Data Studio
A single, unified dashboard that gives your leadership team a real-time view of the metrics that matter most to your business without switching between 8 different tools or waiting for a weekly data team report.
Design to delivery: we work with your existing data infrastructure (whatever platforms and databases you currently use), design a dashboard architecture that surfaces the metrics most important to your specific strategic priorities, build the dashboard with full data connection, and train your team on how to use and interpret it.
Typical dashboard components for Indian SMEs and startups:
- Revenue and growth metrics (daily/weekly/monthly, by segment and channel)
- Customer acquisition metrics (CAC by channel, lead-to-conversion rates, pipeline velocity)
- Retention and engagement metrics (churn rate, repeat purchase rate, cohort analysis)
- Operational performance metrics (fulfilment speed, service resolution time, cost per unit)
- Financial health metrics (gross margin, burn rate, runway, cash flow forecast)
Survey Design, Fieldwork Management & Statistical Reporting: Primary research with analytical rigour for consumer insights, employee research, or market validation
For businesses that need original primary data, we design the survey instrument (questionnaire architecture, question sequencing, response scale selection), manage fieldwork (sampling strategy, data collection platform, quality control), conduct statistical analysis (cross-tabulations, significance testing, cluster analysis for segmentation), and produce a research report with findings, visualisations, and strategic implications.
Best for: Consumer research before a product launch | Customer satisfaction measurement with actionable segment-level findings | Employee engagement research | Validation research for investor materials.
Sales & Marketing Funnel Analytics: Convert your funnel data into acquisition intelligence
A structured analysis of your current sales and marketing funnel: where leads enter, where they convert, where they drop off, and what the conversion metrics at each stage reveal about the effectiveness of your acquisition strategy. Includes:
- Funnel visualisation (stage-by-stage conversion rates with benchmark comparisons)
- Drop-off analysis (which stage loses the most leads and the most likely causes)
- Channel attribution (which channels produce the highest quality leads at the lowest acquisition cost)
- Cohort analysis (how different customer cohorts by acquisition channel, timing, or segment perform over their lifecycle)
- Recommendations: the 3–5 specific interventions most likely to improve funnel conversion meaningfully
Competitive Data Visualisation: Turning competitor research into visual decision tools
For businesses that have conducted competitor research (either with us or independently) and need it presented in visual formats suitable for board presentations, investor meetings, or strategic planning sessions. We convert raw competitive intelligence into:
- Competitive positioning maps (visual matrix format)
- Feature/capability comparison matrices (visual side-by-side)
- Pricing landscape visualisations (positioning across price and value axes)
- Market share signal charts (relative digital footprint as a proxy for market position)
Investor-Ready Data Presentations: Research-backed data presentations for fundraising and board communications
For founders preparing investor decks or board presentations who need their data presented in the visual format and analytical depth that sophisticated investors expect. We produce investor-ready data presentations that include:
- Market opportunity visualisations (TAM/SAM/SOM charts with source documentation)
- Competitive landscape maps (visual competitive positioning)
- Traction visualisations (growth charts, cohort data, unit economics dashboards)
- Financial model visualisations (revenue forecast charts, unit economics graphics, scenario comparison visuals)
Data Analytics Pricing
| Package | Scope | Investment |
|---|---|---|
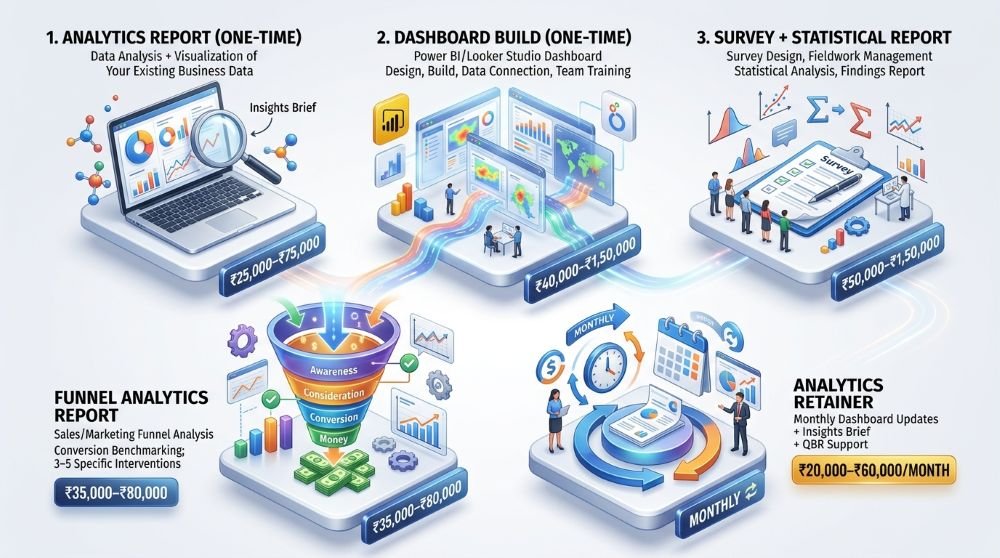
| Analytics Report (One-Time) | Data analysis + visualization of your existing business data; insights brief | ₹25,000–₹75,000 |
| Dashboard Build (One-Time) | Power BI/Looker Studio dashboard; design, build, data connection, team training | ₹40,000–₹1,50,000 |
| Survey + Statistical Report | Survey design, fieldwork management, statistical analysis, findings report | ₹50,000–₹1,50,000 |
| Funnel Analytics Report | Sales/marketing funnel analysis; conversion benchmarking; 3–5 specific interventions | ₹35,000–₹80,000 |
| Analytics Retainer | Monthly dashboard updates + insights brief + QBR support | ₹20,000–₹60,000/month |